But space on your website is limited, so knowing which visual assets have the strongest impact on sales is key. Yotpo’s brand new Photos Performance Dashboard is designed to provide you with this insight and more.
First, let’s take a look at the bigger picture: Surveys indicate that showcasing only professional product images on eCommerce sites leaves people guessing. Whereas with customer photos, shoppers can see how your products are used and enjoyed in everyday life. In fact, we found that 77% of eCommerce buyers prefer user-generated photos to professional ones.
When consumers see people just like them wearing your brand’s clothing, for example, social proof increases, and so does purchase likelihood. Organic, Instagram-style user-generated images increase conversion rates by 25% over professional photos. Not only that, but having all those pictures on-site and on your social channels boosts brand awareness, drawing in more new shoppers.
This brings us back to our initial question: We know the stats on the benefits of customer photos, but what are they doing for your business specifically? Website real estate is valuable, and galleries and other visual assets should be worth the space they take up and then some.
With everything from the Photos Carousel to Shoppable Instagram and photos submitted with reviews, it can be tough to know what’s working for your visual eCommerce strategy and where changes need to be made.
The Photos Performance Dashboard shows you the bottom line value of your visual customer content, giving you actionable insights to maximize the benefits of customer photos.
Use it to track the performance metrics of your photos, including how many shoppers interact with on-site photos, which visual assets drive the most engagement, and which drive the most conversions.
If you notice that certain assets spark much higher conversion, you can change up their placement to maximize exposure. You can also try displaying different types of customer photos to see how shoppers respond.
Once you understand what turns your browsers into buyers, you can develop a stronger and more impactful eCommerce visual marketing strategy.
With the charts below, you can measure your insights from the Photos Dashboard against the standard in your industry to see if your customer photos are driving engagement and converting at the benchmark rate.
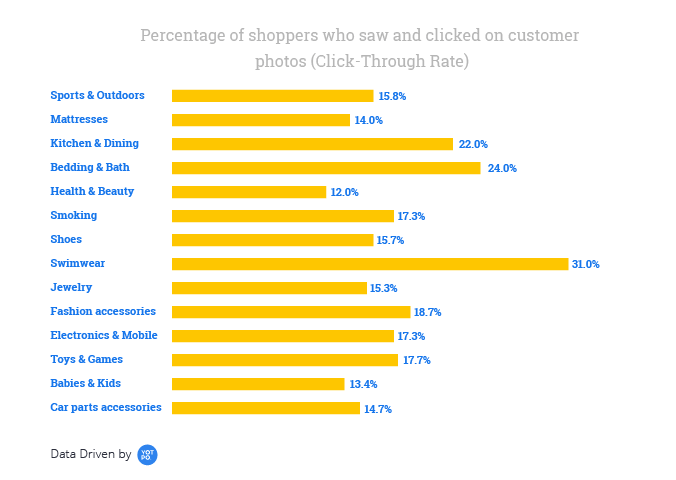
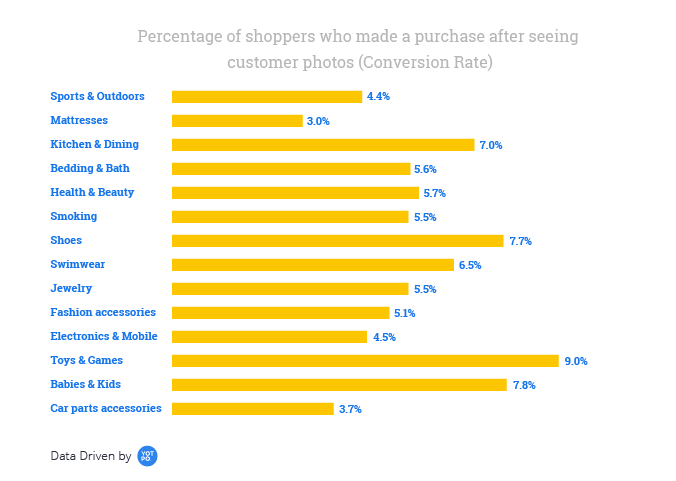
Not only that — the Photos Activity Dashboard allows you to keep a pulse on photo generation, publication, and product coverage.
If you have uneven product coverage — some products with tons of photos and some with few or none — you can send targeted requests for photos to customers who have purchased low-coverage items and close the gap.
This will help you keep up with industry standards for product coverage. For example, furniture businesses typically publish customer photos for 23% of products, followed by pet supplies businesses at 22%. You can use the insights from the Photos Dashboard to find out if your shoppers are expecting more photos on your site.
Below, you can see the percentage of products featuring customer photos per industry.
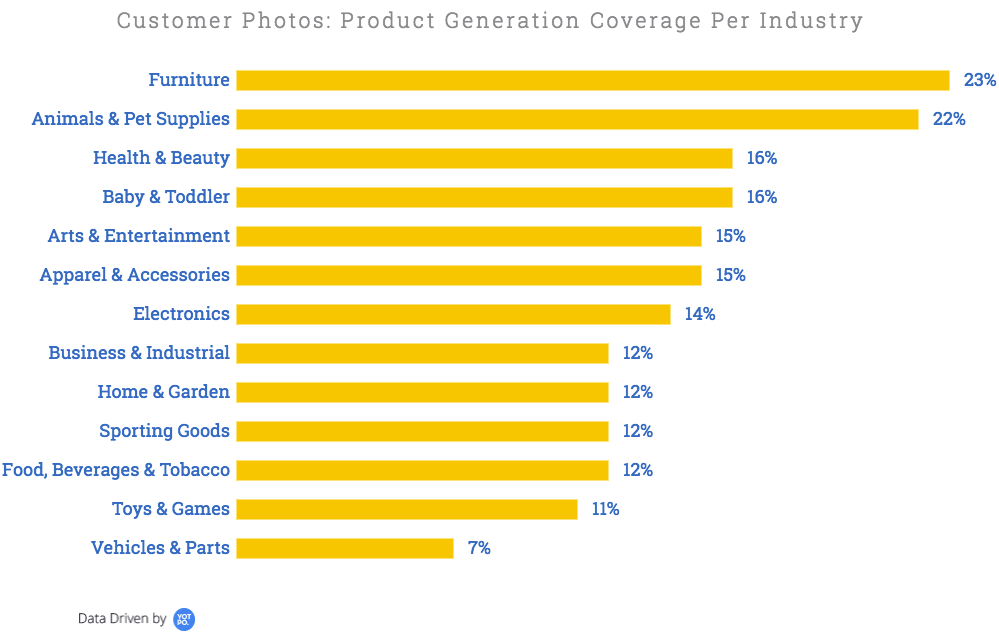
Whether you’re selling electronics, swimwear, or anything in between, you can gauge your improvement over time and refine your visual marketing plan to keep up with industry benchmarks.
Now that you know all the ways to get the most out of your photo analytics, get started with your Photos Performance Dashboard to find out where your business fits in and how you can ace your visual marketing strategy.







 Join a free demo, personalized to fit your needs